P-01archivedInstrumentation · 2024
Digitalization of Wien's Displacement Experiment
An Arduino Uno R3 and TCS34725 RGB-sensor based system that digitizes Wien displacement experiment readings and turns serial data into wavelength-intensity plots with Python.
- Role
- Developer · Data Acquisition & Analysis
- Timeframe
- Sept 2024 - Oct 2024
- Domain
- Instrumentation
- Status
- archived
- Accuracy
- 99.99%
- Sensor
- TCS34725 RGB
- b value
- 2.998e-3
Overview
This project digitizes the Wien displacement experiment by pairing an Arduino Uno R3 with a TCS34725 RGB sensor and a Python-based analysis layer.
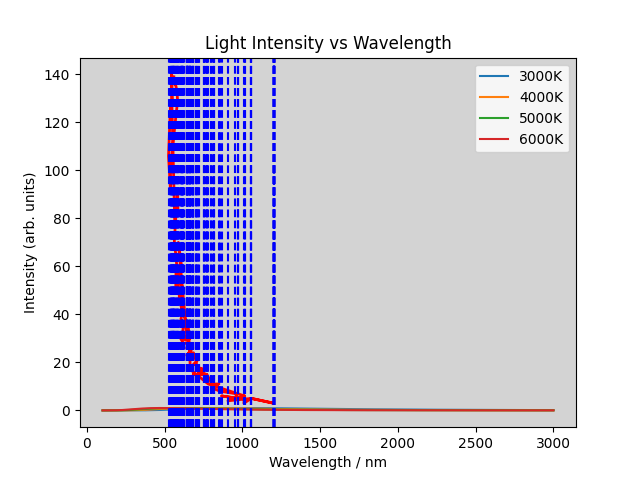
The workflow captures experimental readings over serial, processes them in software, and renders intensity-versus-wavelength plots for analysis and reporting.
The Challenge
The main problem was turning raw sensor readings into a clean, repeatable experiment workflow that could be analyzed without manual spreadsheet chaos and inconsistent plotting.
Approach
- 01Used Arduino-side serial output to stream sensor readings from the TCS34725.
- 02Processed the incoming data in Python using NumPy, Pandas, and Matplotlib.
- 03Converted measurement sets into wavelength-intensity graphs for Wien displacement evaluation.
- 04Kept the codebase split into acquisition and analysis layers so the experiment stayed maintainable.
Outcomes
- Produced a working digital measurement pipeline for the Wien displacement experiment.
- Generated reproducible plots and report assets from the experiment data.
- Kept the implementation lightweight with a C++ plus Python stack.
Stack
Hardware
- Arduino Uno R3
- TCS34725 RGB sensor
- Serial connection
Software
- C++
- Python 3.8.10
- Matplotlib
Data
- NumPy
- Pandas
- Excel